- Trendency's Consumer Trendwatch Newsletter
- Posts
- Trendency's Consumer Trendwatch Newsletter-May 2024
Trendency's Consumer Trendwatch Newsletter-May 2024
How do you feel about the economy?
Trendency Research
May 20, 2024
Trendency’s Consumer Trendwatch Newsletter
What is your political party? How do you feel about the economy?
A person’s affiliation with a certain political party or ideological group is bound to influence many aspects of everyday life; from reproductive rights to gun laws to taxes. Party affiliation and/or ideology is becoming the single most important defining factor in predicting how someone will feel about certain policies. While this relationship makes sense on many issues, a partisan lens is now being applied to almost every issue, including economic measurements.
In almost every survey, economic issues tend to rise to the top of the concerns Americans have. While this makes sense given what the economy has been through over the past four years, the views on the strength of the economy, or how an individual views their own economic standing is based more and more on their political leanings as opposed to their income or other demographic delineations that arguably have a more direct relationship to their economic stability.
While not necessarily shocking that partisanship is seeping into all facets of life in the United States, it does mean that traditional measurements are no longer going to paint the picture of how the economy is truly being viewed.
The Economy Overall
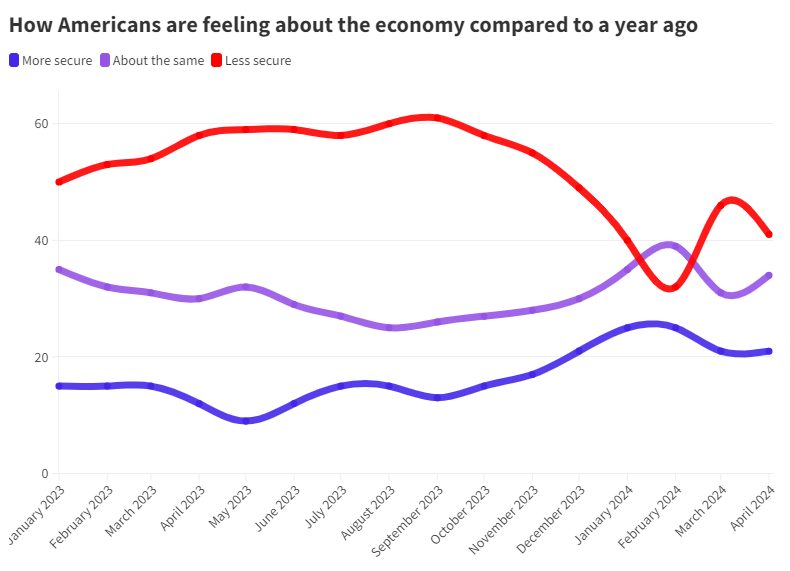
In general, Americans are feeling better about the economy than they were compared to a year ago according to our data. Feelings of having less financial security have greatly diminished since August 2023, when Americans rated their sense of insecurity at 60 points out of 100 compared to the previous year. Now, that number has decreased by 20 points: feelings of increased security, or unchanged economic security, have slowly but steadily increased.
When we ask a similar question in the context of income, Americans who make over $80,000 per year, predictably, are the most likely to say that their personal economic situation is better off (29%). Americans who make under $40,000 per year are the least likely to say the same (13%) while those who make between $40,000-$80,000 say something similar to the overall average – 17% feel better off compared to a year ago.

Most Americans, regardless of income, say that they feel either better off or about the same compared to a year ago. These statements follow a predictable pattern based on income levels, with those making lower incomes being more likely to say they feel worse off compared to a year ago and those at a higher income level feeling better about their situation.

Personal Economic Situation Compared to Last Year by Income (May 2024)
After looking at how key demographic groups answer this question, we found that income is not the only differentiator of how Americans feel about their personal economic situation. When asked how their personal economic situation today compares to last year, Democrats (47%) and Black/African American panelists (45%) are the most likely to say their situations are about the same as this time last year, while Latinx/Hispanic panelists (32%) and Republicans (30%) are the least likely groups to say it’s the same. After looking at how key demographic groups answer this question, we found that income is not the only differentiator of how Americans feel about their personal economic situation. When asked how their personal economic situation today compares to last year, Black/African American panelists (45%) are the most likely to say their situations are about the same as this time last year, while Latinx/Hispanic panelists (32%) are the least likely to say it’s the same

On the other hand, the division in opinions based on party is stark. Democrats are the most likely demographic to say that their personal economic situation is better off (24%) and Republicans are the most likely to say worse off (53%). Americans who affiliate with the GOP are far more likely than those in other parties to say that they are worse off economically this year, while Democrats are more likely to say that they are feeling either better off or about the same.

While the fact that political affiliation contributes to how someone thinks about an issue is not shocking, but it is surprising how much it supersedes income. Overall, 29% of those making more than $80,000 feel that they are doing better than last year, while 35% say they are doing about the same, and 33% say they are worse off.
Among Biden voters the higher the income the more likely they are to feel better off economically than they did last year. Indeed, 19% of Biden voters who make less than $40,000 feel that they are better off now compared to last year, while 34% of those making more than $80,000 feel the same way.

Among Trump voters income has less of an effect on the positive end of the spectrum with just 11% of Trump voters who make less than $40,000 and those who make between $40,000-$80,000 feeling that they are better off compared to a year ago. Just 15% of Trump voters making more than $80,000 feel the same way.

On the negative end of the spectrum, Biden voters follow an inverse pattern of the positive views. A third (33%) of supporters of the President who make less than $40,000 feel they are worse off compared to a year ago. Among those who make more than $80,000 the percent drops down to 15%.

Among Trump voters, the pattern is reversed, where the more money they make, the worse off they tend to feel about their economic situation. Just under a half of Trump voters who make less than $40,000 feel they are worse off compared to a year ago, while 59% of those who make more than $80,000 feel the same way.

Inflation
At the root of the question about someone’s personal financial situation, at least these days, is concern about inflation and fears of recession. While inflation remains higher than most would like, Federal Reserve Chair Jerome Powell denied claims of an economy facing stagflation, defined as simultaneously high inflation and slow economic growth. Overall the United States has one of the lower inflation rates in Europe and North America and economic growth has been positive since the middle of 2022.
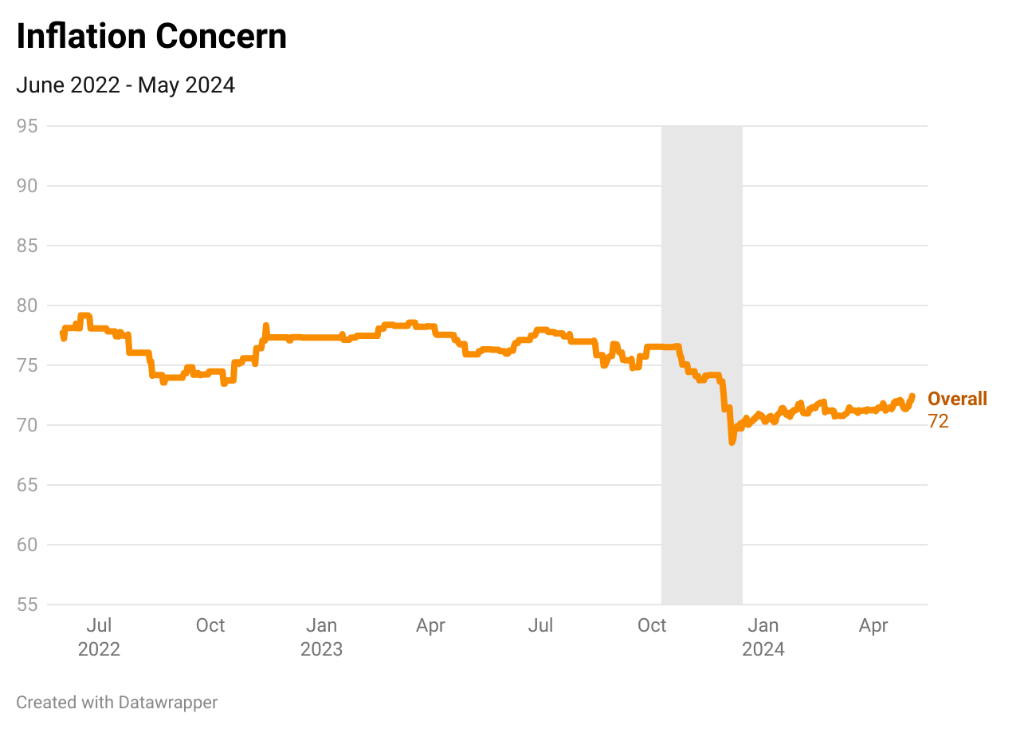
Regardless of what the number say about inflation, when asked about the economy, Americans that are part of our national Trendency panel remain concerned about the issue of inflation overall, providing an answer of 72 out of 100, on average. This is high. But there is some positive news about this figure: it’s six (6) points lower than it was at this time last year, when average concern was ranked at 78 out of 100.
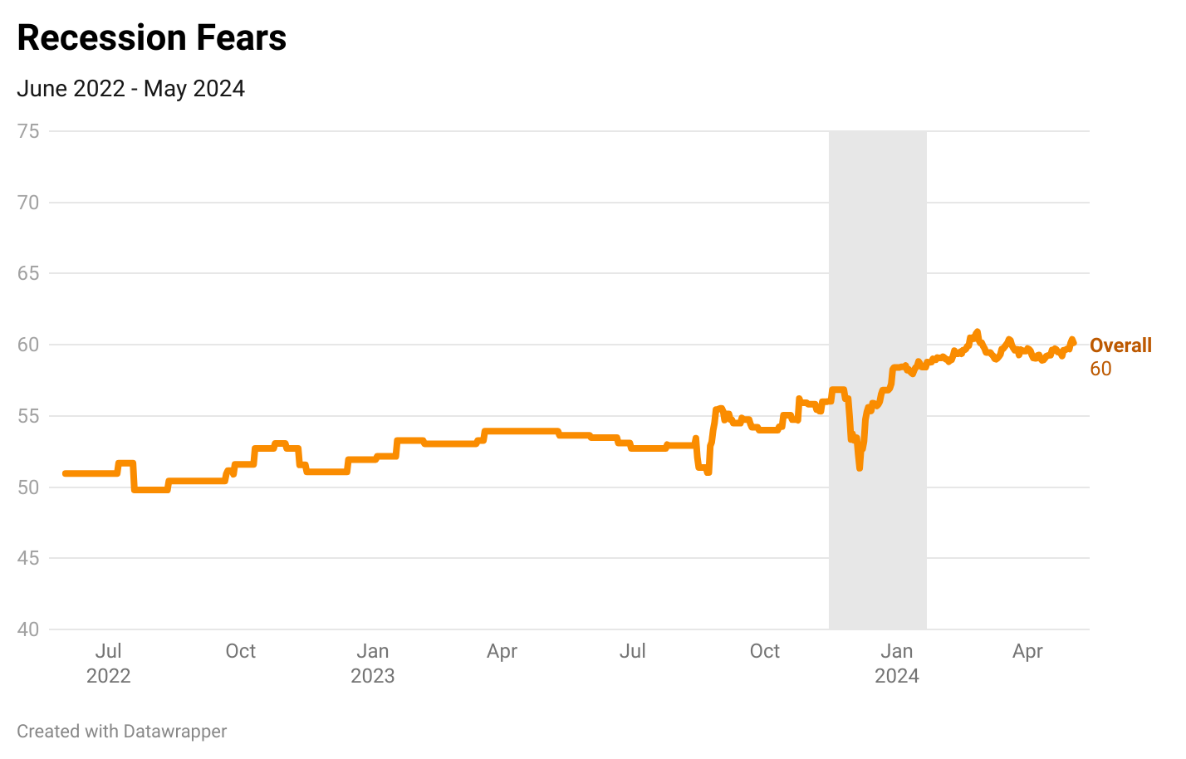
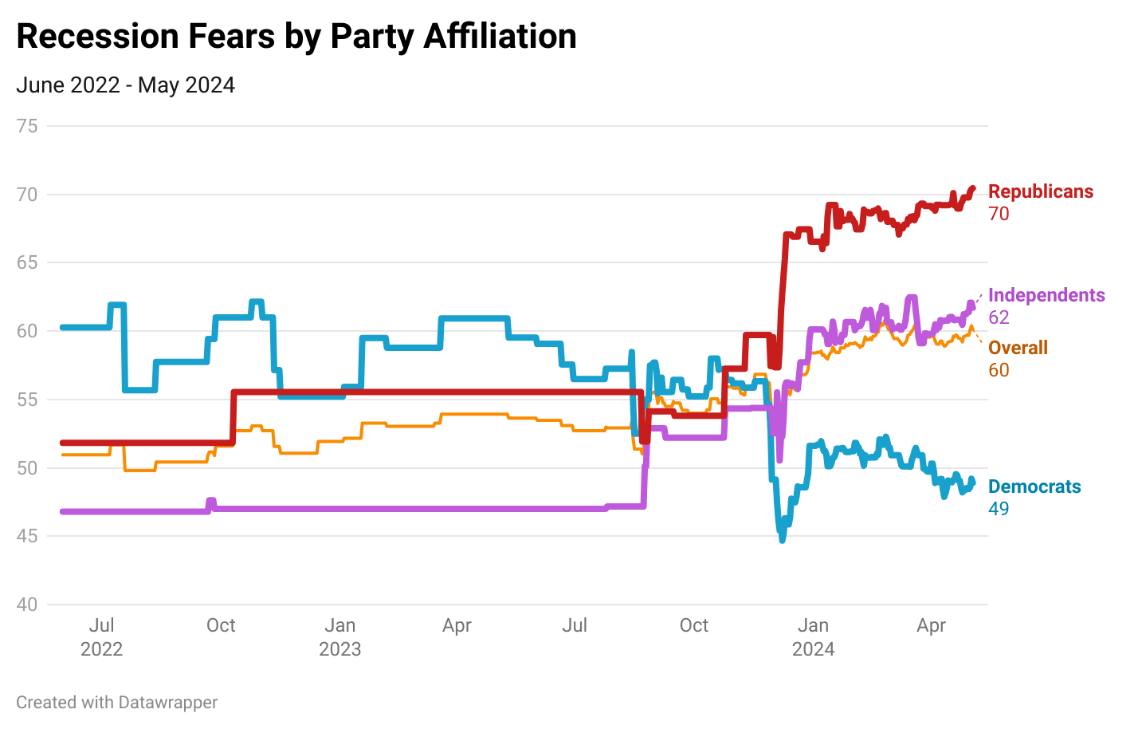
Simultaneously, fears around recession do not see such positive numbers. Despite the Fed Chair’s insistence that a recession is not imminent, panelists have increased their reported fears of recession by an average of 9 points out of 100 – from 51 to 60 – since October.
However, as with almost everything in a presidential election year, decisions made by the Fed and opinions around the economy have become even more partisan. Party affiliation is not only a leading indicator of how Americans view their personal economic situations overall, but also regarding inflation and recessions.
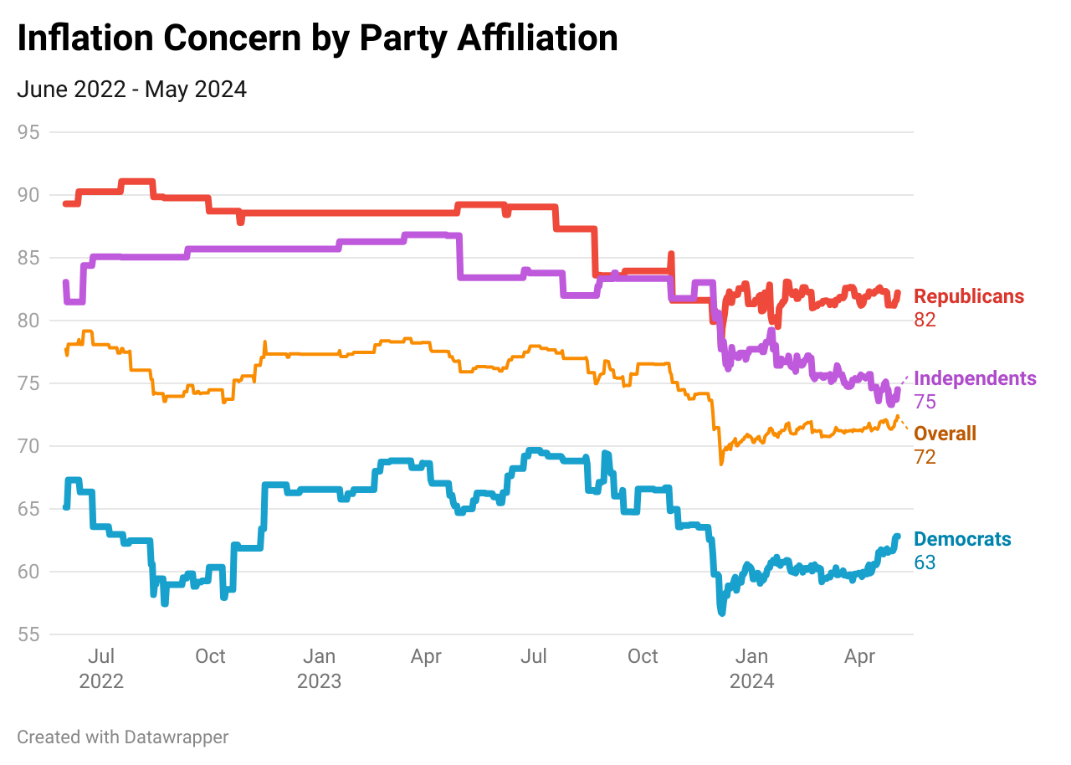
Despite relatively less concern about the issue of inflation, opinions differ greatly by some demographics, especially by party affiliation: Independents allocate 75 points – close to the overall average – but Republicans allocate 82 points and Democrats allocate just 63 points. This marks a 19-point, statistically significant * average difference in concern between Democrats and Republicans regarding the same economic indicator. The partisan division surrounding inflation is certainly not new – we’ve seen similar divides for over two years in how Americans view inflation – but the divide in opinions between Democrats and Republicans has been widening since at least September 2023.
An even starker division has appeared in fears of recession. When asked how much they fear a recession, Democrats allocate 49 points out of 100 to the question on average. Republicans allocate 70 points– a 21-point difference between the two parties. These differences in opinion between the three parties are statistically significant. **
This data from our national panel indicates that discussions around the state of the economy often can’t be divorced from partisanship, with both major Presidential candidates taking vastly different approaches to talking about the economy on the campaign trail. President Biden has been touting his signing of the Inflation Reduction Act as a key victory of his administration for over a year, while former President Trump has been weighing the possibility of diminishing the Federal Reserve’s political independence if he wins in November. These public and highly partisan economic debates have not only led to a divided electorate, but – as demonstrated in our analysis – they’ve also influenced how Americans view their own personal economic situations, inflation, and the potential for a recession.
As we gear up for what will likely be one of (if not the most) consequential elections in American history, influences of party affiliation and ideology on voters’ most important issue – the economy – will be vital to understand the outcome of November 5, 2024.
*A one-way ANOVA test was conducted to determine the significance of the differences in allocation means between Democrats, Independents, and Republicans for the question of inflation concern. Bartlett’s test indicated potentially unequal variances, so in this case, three separate Welch’s t-tests were conducted to determine the significance of differences between 3 groups of n > 100. Differences in opinion appear significant within a 99% confidence interval.
**A one-way ANOVA test was conducted on three groups, assuming equal variances, to determine the significance of the differences in allocation means between Democrats, Independents, and Republicans for the question of recession fear. Differences in opinion appear significant within a 99% confidence interval for 3 groups of n > 100.