- Trendency's Consumer Trendwatch Newsletter
- Posts
- The Perceived Value of Streaming
The Perceived Value of Streaming
Just like cousin Wilhelm, Netflix is killing it
Trendency Research
December 05, 2024
A month ago, Trendency examined subscription growth among streaming services and who has made the biggest gains as well as who has been shedding reported subscribers. Netflix remains at the top in terms of overall concentration of subscribers in the US; however, there are a few other services that are not far behind, including Amazon Prime Video and Hulu. In this installment, we are taking a look at how happy consumers are with their subscriptions - specifically, through the lens of how much value subscribers feel they are receiving for their monthly payments.
Trendency created its Perceived Value Score (PVS) in 2021 to determine the likelihood of a subscriber leaving or sticking with their current subscription. The score is based on multiple inputs resulting in a zero to 100 scale, where the higher the score the higher the value a consumer puts on that particular subscription, and the less likely a subscriber is to cancel their subscription.
Overall, consumers are generally happy with their streaming subscriptions and the last year has been positive for all of the services tested. Interestingly, the movement tends to be relatively consistent across all platforms, which points to the overall strength of the industry, and how much our entertainment consumption habits have changed over the past decade.
Overall Satisfaction
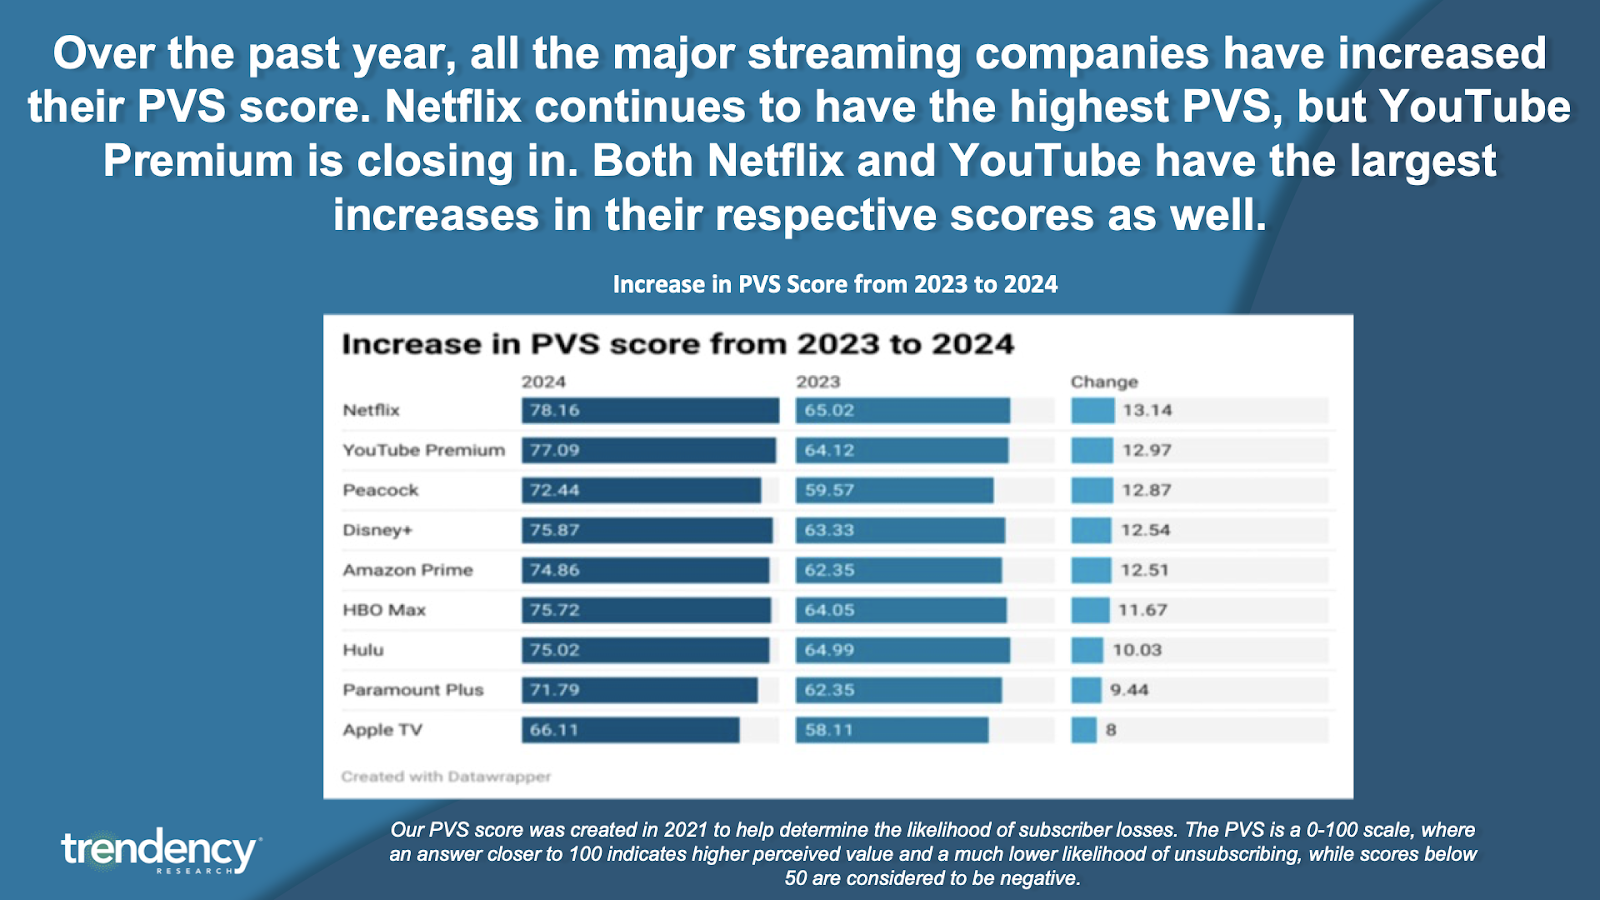
Netflix sits at the top of our PSV ranking with the highest Perceived Value Score for the third year in a row, while YouTube Premium, Disney Plus, HBO Max, Hulu, and Amazon Prime sit closely behind. For these five services, the average scores are similar and the exact rank order is not overly telling (at least in the average). After this cohort of five services, there is a bit of a drop for Peacock and Paramount Plus, while Apple TV is well behind the other services even with many critically acclaimed shows on the platform.

Netflix not only has the highest overall PVS score, but it also made the biggest gain since 2023. YouTube Premium and Disney Plus are creeping up as both have increased their scores by around 13 percentage points. Peacock has also made gains compared to last year with a 13 percentage point improvement (the third highest), but they remain in the bottom half of overall perceived value. As for Amazon Prime Video and Hulu, each has increased by around 12 and a half percentage points while HBO Max has increased by around 11 and a half percentage points. Similar to the previous slide, most of the streaming services have increased at a similar rate since 2023 except for Paramount Plus and Apple TV.
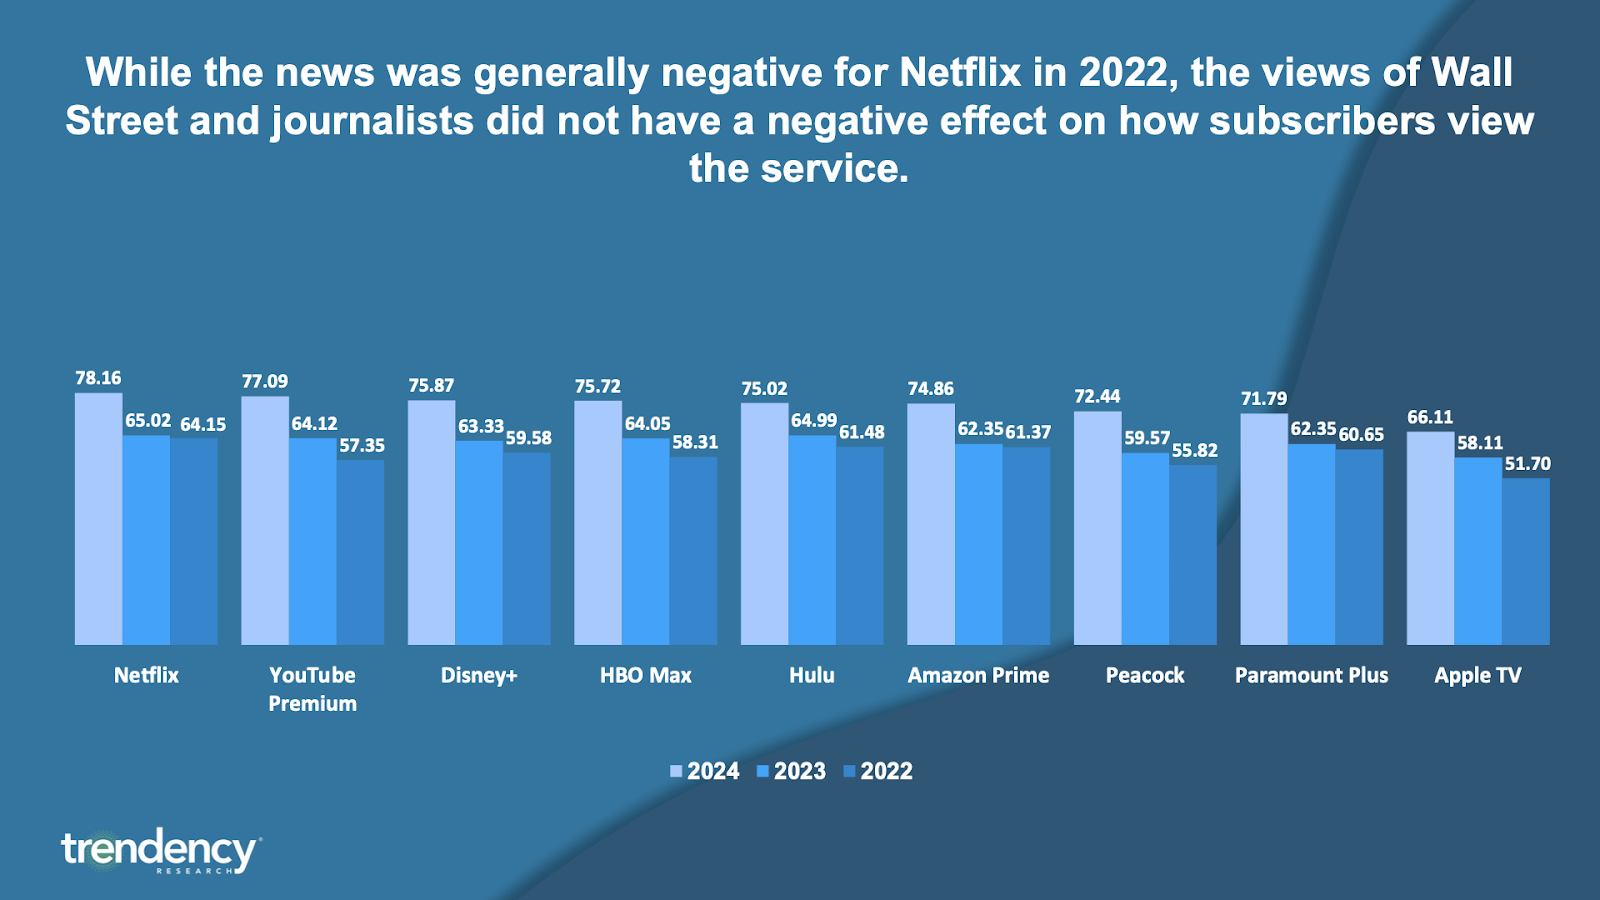
When Trendency first started calculating perceived value in 2021, consumers tended to have a more muted reaction to the value they felt they were receiving. This was not affected by the amount of time spent streaming or the number of services they were subscribed to. After collecting more than three years of data, we can see how consumers' perceptions of streaming service value have increased across the board. This industry-wide increase in the perception of value generally bodes well for the industry, although the lack of differentiation could provide challenges for the services that are further down the rankings in terms of the number of subscribers.
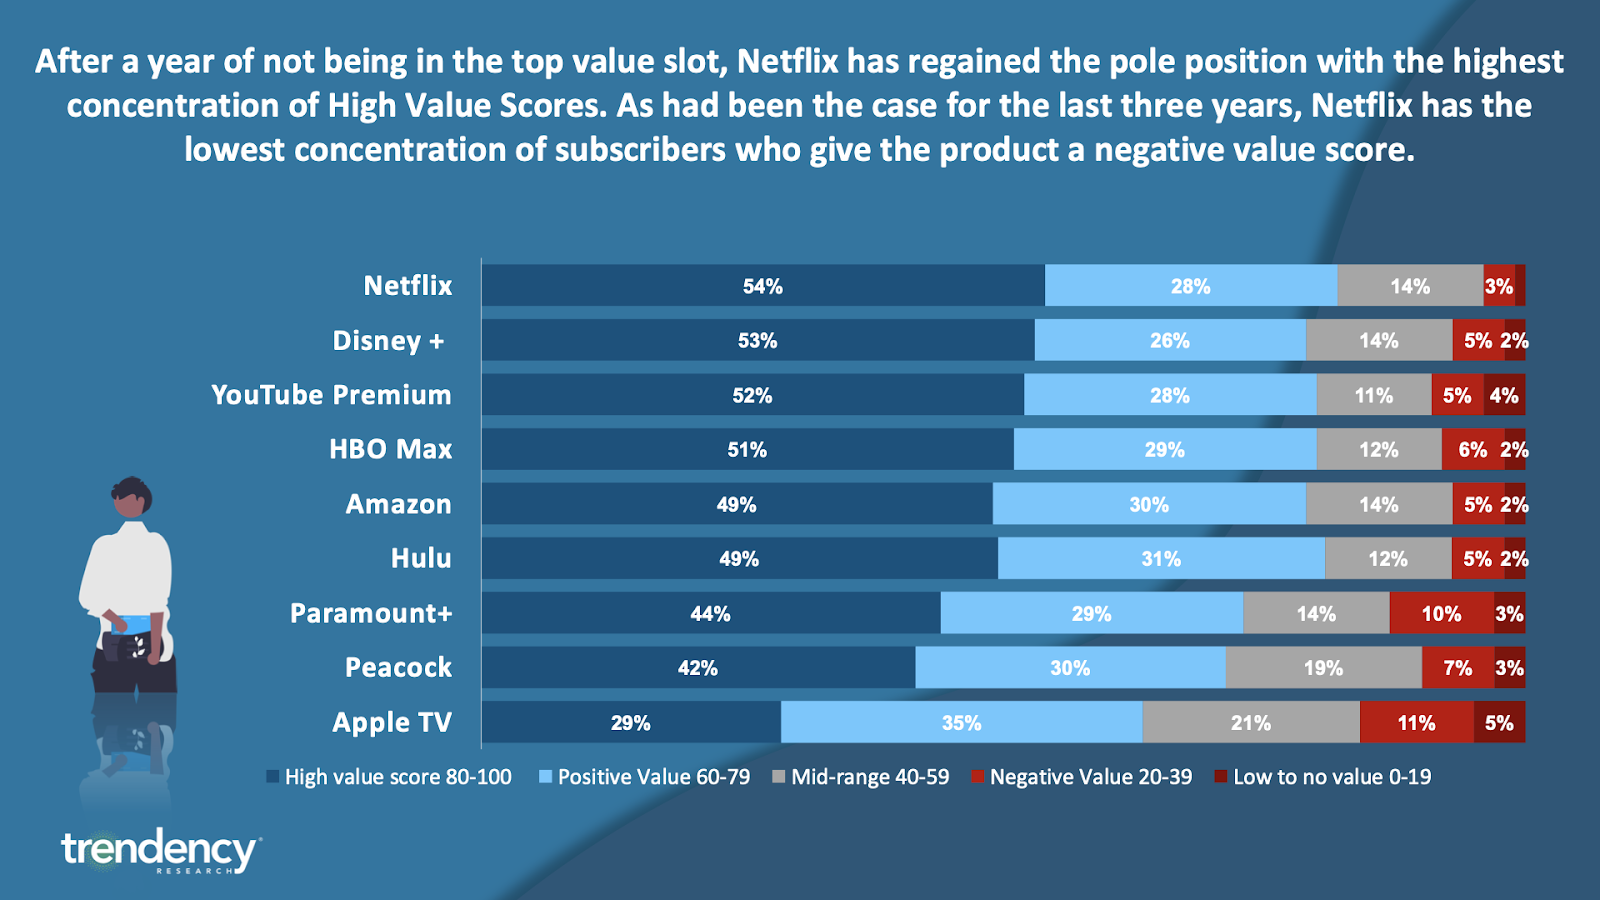
Along with having the highest overall perceived value score, Netflix has regained the top position with the highest concentration of high-value scores as well as the lowest concentration of subscribers who give the product a negative value score (the most likely group to cancel their subscriptions). Netflix is interested in maintaining this position with their move to streaming live sporting events for their members, such as the recent Mike Tyson vs. Jake Paul boxing match, for which the streaming platform boasted 108 million worldwide viewers, and their announced deal with the NFL securing streaming rights for their Christmas games for the next three years.
As is the case with other measurements, Netflix is in a clear number one position although not by wide margins. The next five services are closely bunched together with very little difference in positive or negative views. Paramount and Peacock are in a clear second tier, while Apple TV consistently ranks at the bottom.
Generational Differences
Gen Z consumers are not just the biggest drivers of growth when it comes to subscription numbers; they also have a clear effect on PVS scores. Looking at the rank order, Netflix is the highest overall but does not rank first for any generation of consumers. YouTube TV has a much smaller subscriber base, but the perceived value for most consumers is incredibly high. The lone exception is with GenZ who ranks the value near the bottom of the group. Hulu is viewed fairly consistently among different generations, as is Apple TV. The other services are less consistent, especially Paramount Plus, which is ranked differently by each generation of consumers.

While the overall changes in PVS were relatively consistent, the movement by generation was less uniform. Younger adult consumers (GenZ and Millenials) have typically been the biggest drivers of growth in the perceived value of the different services. Out of these four generations, Gen X has given substantially lower scores for major streaming services compared to the other generations.

Differences by Habits
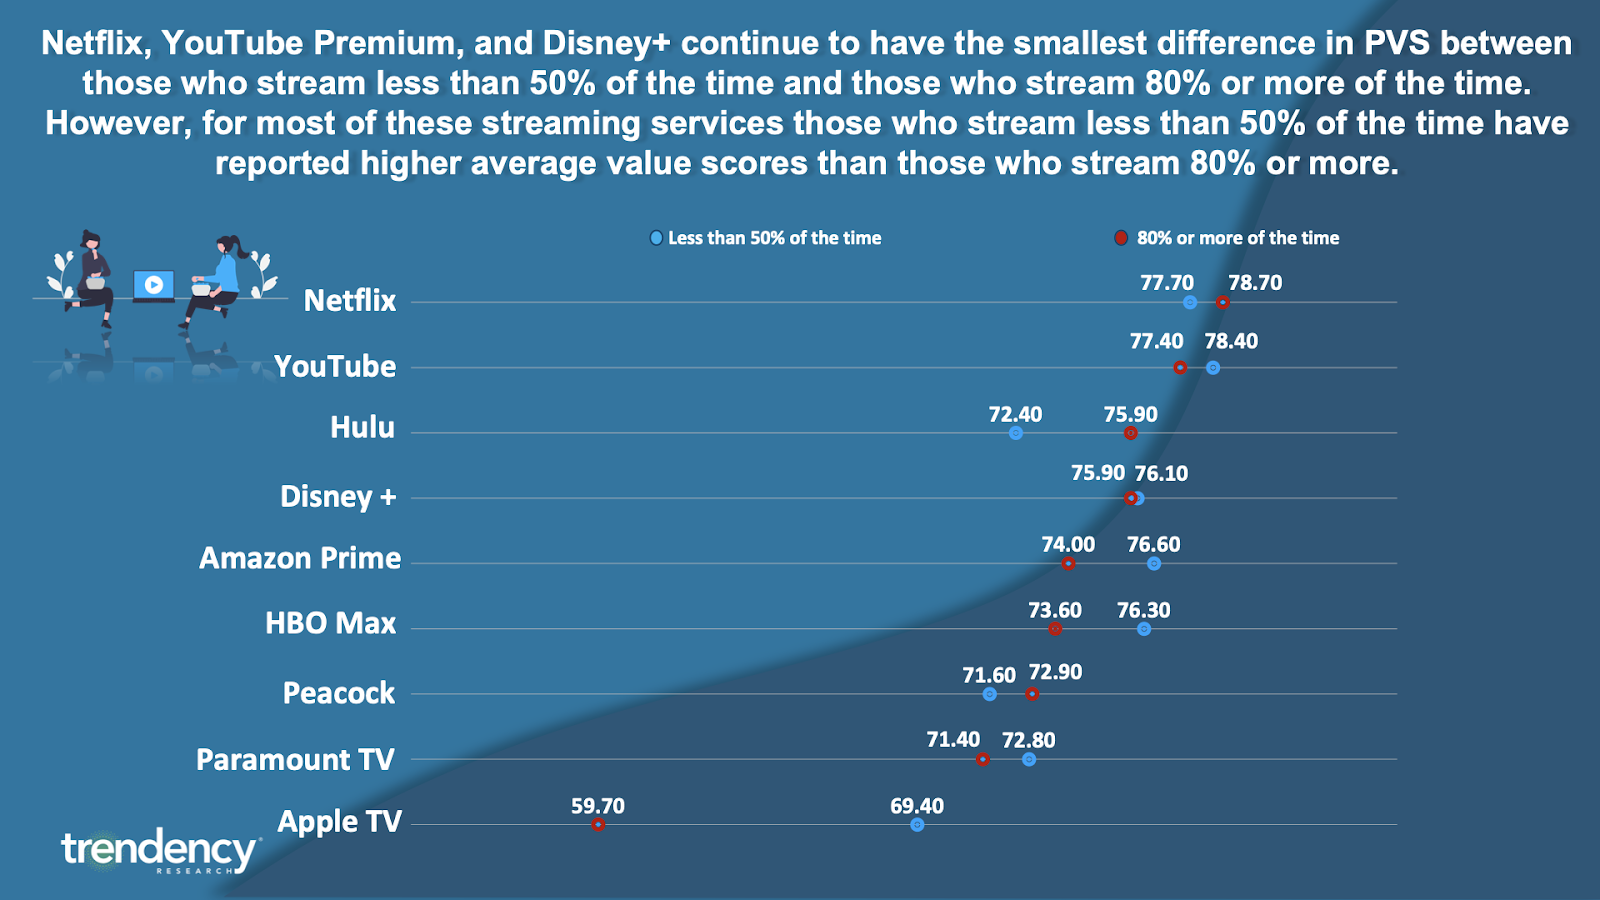
Netflix, YouTube, and Disney Plus not only have the highest overall Perceived Value Scores but also have the smallest differences between those who stream less than 50% of the time and those who stream 80% or more of the time. It is important to note that in many of these cases, those who stream less than 50% of the time reported higher average value scores than those who stream 80% or more. Overall, this is good news for the platforms when it comes to subscriber retention rates. Among those who stream their entertainment 80% or more of the time, there is relative consistency in the PVS ratings (except for Apple TV). However, among those who stream less than 50% of the time we see more differences in both the overall score but also in how that score compares to the more consistent streaming consumers.
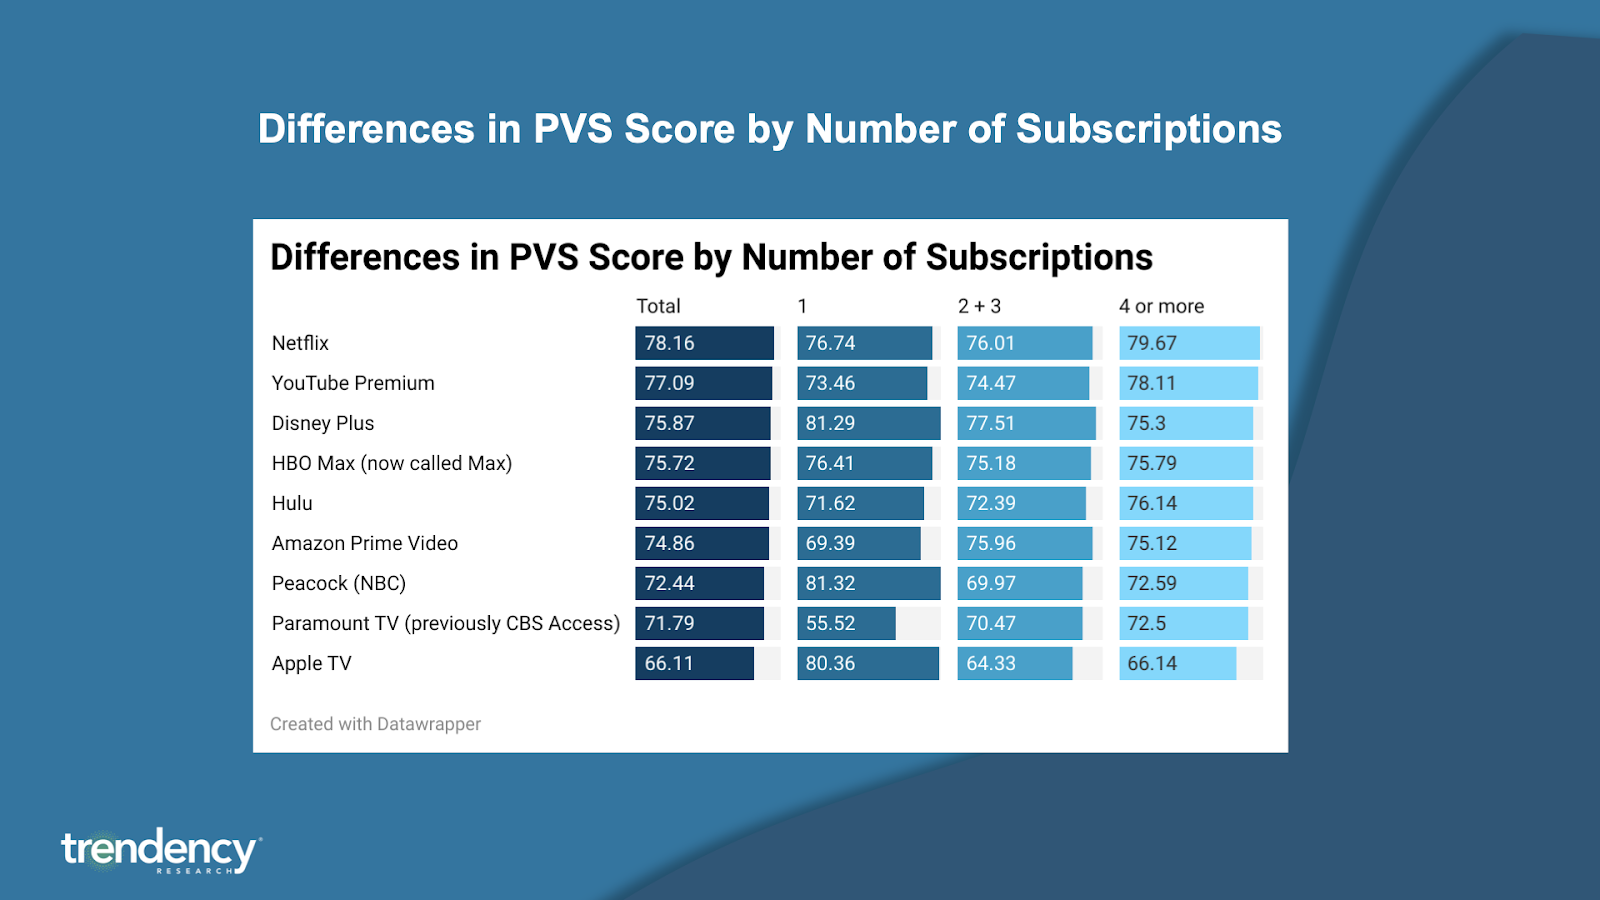
Looking at the PVS based on the number of subscriptions a consumer has, there is interestingly little difference among those who have four or more subscriptions or those with 2 or three subscriptions. Among those who have only one subscription, the view on the value is similar for most of the services. The exceptions are Paramount Plus (much lower) and Apple TV who have some of the higher scores among this cohort compared to consumers overall.
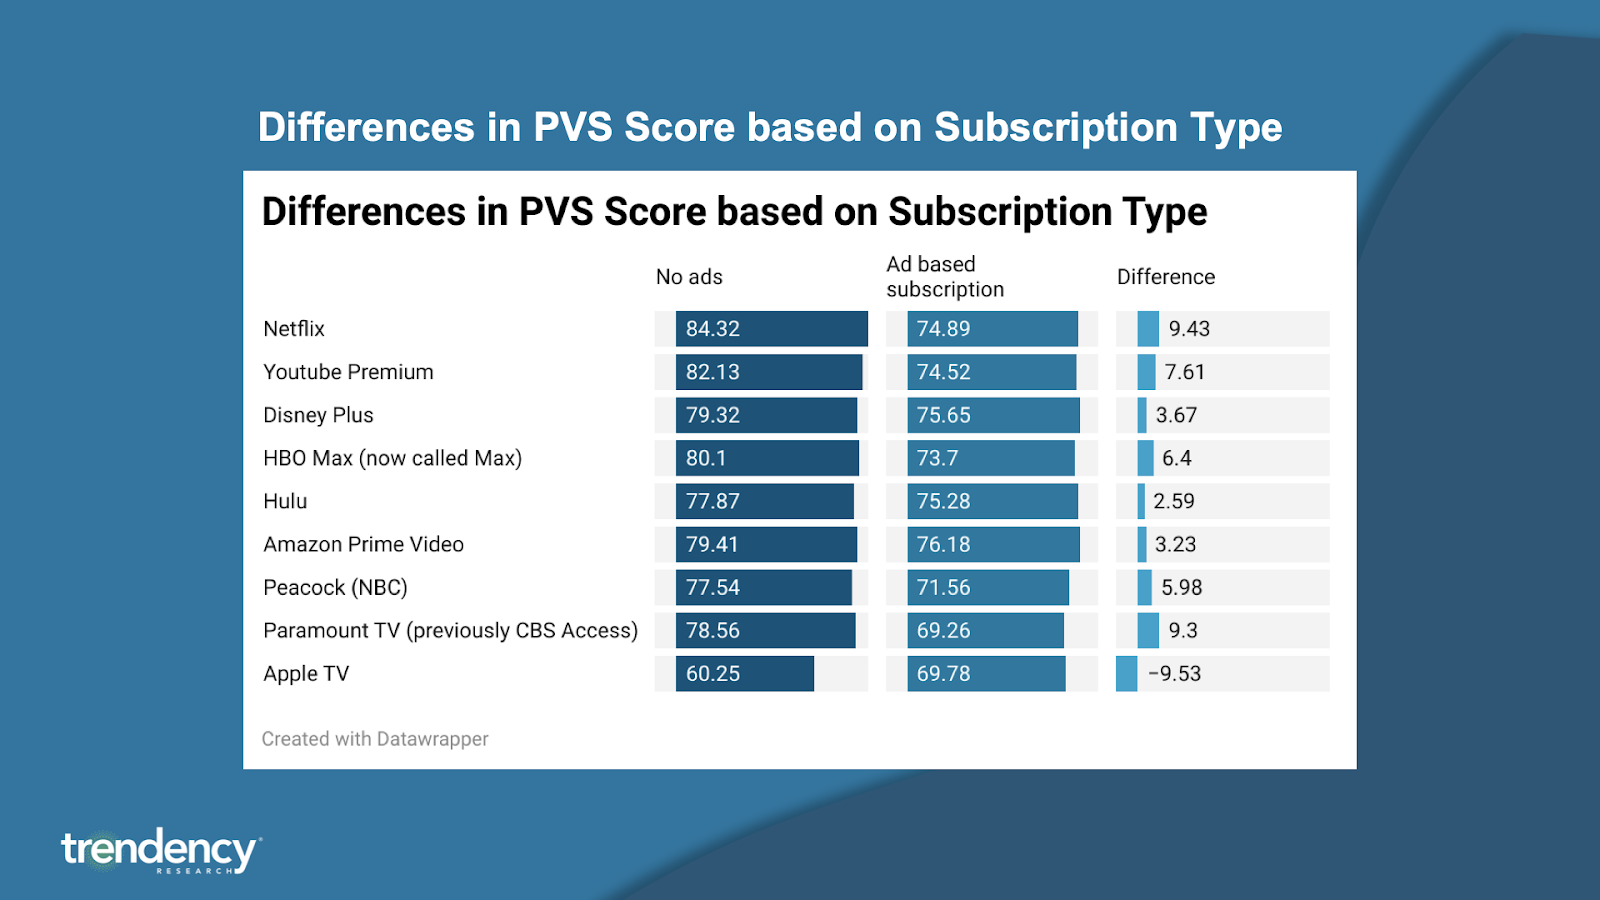
While most platforms have been testing out ad-based subscriptions there are some cautionary indicators in the data that the streaming services should be aware of. In general, consumers who have no-ad subscriptions place a higher value on that subscription. For some services such as Netflix and Paramount Plus, the differences are nearly double digits (9.43 points and 9.3 points, respectively). The one service that has the smallest difference between ad-based subscriptions and those with no ads is Hulu (+2.59). Surprisingly, Apple TV is the only streaming service to have a higher perceived value score when it comes to having an ad-based subscription versus no ads as the difference between the two is 9.53 points. As one of the first services to offer the choice between the two subscription types, the lack of difference could be based on the overall approach to the ad-based offering or a natural settling of the data as those with ads become used to the experience. It will be interesting to see if platforms such as Netflix who have more recently added this option to the mix will see an effect on their overall subscriber base.
Wrapping up this year's streaming data, we have seen obvious gains among all streaming services when it comes to number of subscriptions and amount of time spent streaming. Big names like Netflix and Hulu remain at the top not only because of increases in subscription growth but they also offer the highest value when it comes to content for consumers. When it comes to the different generations, there are stark differences in preference among consumers. For Gen Z and Millenials, newer services like Disney Plus are catching traction as both generations find the streaming service to offer high value. For Gen X and Boomers, YouTube TV enjoys a high-value perception likely attributed to the more macro-level shift away from traditional cable and streaming services for live television among generations that were the original cable consumers.
Netflix continues to lead the pack when it comes to just about every measurement. The other services have closed the gap over the past few years, but Netflix continues to be the dominant entry point into this form of entertainment and continues to be seen as innovative and offering a high value. Apple TV continues to lag behind their competitors, however, for Apple streaming seems to be one of the lower priorities.
One of the more interesting things to keep an eye out for is how the platforms handle ads and the desire to capitalize on the big pool of money sitting out there. If done well, there is a big upside financially, however, there is also a good chance that the move back to ad-based television will start to turn consumers away. With the continuous drop in viewership of live events and cable, the value of eyeballs on the streaming platforms will continue to increase, but ultimately losing subscribers will likely not outweigh the additional revenue for many of the platforms. How this relationship is handled is something we will be keeping an eye on over the next few years.