- Trendency's Consumer Trendwatch Newsletter
- Posts
- Streaming Growth: The Dominance Continues
Streaming Growth: The Dominance Continues
An Update on How Americans are Consuming Entertainment at Home
Trendency Research
September 03, 2024

Streaming Growth: Where Do We Go From Here?
As we move deeper into the 21st century, it is not surprising that we continue to see changes in how Americans consume their entertainment. Over the past two and a half decades, we have gone from a world where DVDs were still a prevalent form of entertainment viewing at home to one with more content available than a person could watch in a year. The trends toward more entertainment consumption at home were already in place, and the pandemic just hit the accelerator button.
In 2021, Americans were still spending most of their time viewing entertainment through cable or digital antennas although it was close to a 50/50 split with time spent streaming. A year later, streaming became the majority and the time spent watching streaming has continued to increase. It is amazing how much the landscape has changed since 2007, when Netflix began to offer “Watch Now” a crazy concept that those with broadband could just pick a movie to watch when they wanted to. For context's sake, this was also the year that the first iPhone was released, AirBnB was founded, and Google bought YouTube. Three of these four things might be interrelated, but all four probably make most of us feel old.
Fast forward to 2024 and we are continuing to see changes in how streaming services are innovating, especially how legacy media companies are combining their more traditional offerings as well as streaming services. Some companies are showing promise in the balance (NBC and Peacock was a great example of this during the Olympics), while others seem to continue to struggle (looking at you HBO). Regardless of how well individual companies are dealing with these changes, the appetite for streaming services continues to grow, albeit at slower rates as we move closer and closer to universal adoption.
These changes are not just a challenge for cable companies and the more traditional entertainment producers, but they are also causing many to question the role of advertising and how budgets should be spent as more and more consumers move to less predictable modes of entertainment, or are using platforms where the expectation is to not have to endure advertisements.
How Americans consume their entertainment has a large impact on almost every aspect of our lives and tracking the changes in behavior is both fascinating and enlightening. Over the next month or two, Trendency will be rolling out our latest results on this topic. We hope you find it as interesting as we do.
Streaming Continues to Grow
The amount of time spent streaming has been increasing for the last three years although the rate of growth has slowed over the past year. Compared to 2023, the average amount of time that Americans spend streaming their entertainment at home has increased by three (3) percentage points and is up 10 points since 2022. Currently, Americans report spending 57% of their home entertainment time streaming, compared to an average of 30% of the time watching cable. The amount of time Americans spend watching programming through digital antennas has remained steady over the past three years.
Over the past two years, the average time spent watching cable has dropped nine points, representing a 23% drop since 2022. The rate of depreciation for cable has clearly slowed over the past year, compared to the movement from 2022 to 2023; however, that is likely not much solace for the cable providers and advertisers. At the same time, with 43% of Americans’ home entertainment time spent watching scheduled programming, the complete demise of traditional programming is unlikely to happen any time soon.

While averages can sometimes hide patterns, this is not the case when it comes to how Americans consume their entertainment at home. In 2022, a quarter of Americans (25%) were spending 90 to 100% of their entertainment time on a streaming platform, while 19% reported that they spent no time on streaming. Fast forward two years, and currently 36% of Americans are spending 90% or more on streaming, while just 14% spend no time on these platforms. The growth of those who stream 90% or more of the time has continued to grow since last year, going from 33% to 36%, while those who spend the majority of their time streaming increased from 44% to 48%. Currently, less than a quarter of Americans say that they spend 20 percent or less of their time streaming compared to 31% who reported this behavior two years ago.

Not shockingly, age has a large influence on the amount of time a person spends streaming. Gen Z Americans report that they spend an average of 74% of their time streaming. Millennials (66%) and Gen X (56%) also report that, on average, they are spending the majority of their time streaming entertainment. Boomers are spending a plurality of their time streaming (45%) with the time spent on cable not far behind (40%). Members of the Silent and Greatest generations are the only ones spending a majority of their time on cable (54%) with a little less than a third of their time being spent streaming (31%).

Gender also has some interesting differences with women reporting that they are spending more time streaming than men. Overall, women spend 61% of their time streaming compared to 27% of time spent watching cable. Men, on the other hand, report spending 53% of their time streaming and a third (33%) on cable. Age and gender also show some interesting differences in watching habits. The biggest difference is among Millennials with Millennial women reporting that they spend 74% of their time streaming while 59% of Millennial men report the same (a 15-point difference). There are differences in other generations but they are much smaller in Gen Z (women 4 points higher), Gen X (women 7 points higher), and Boomers (women 6 points higher).
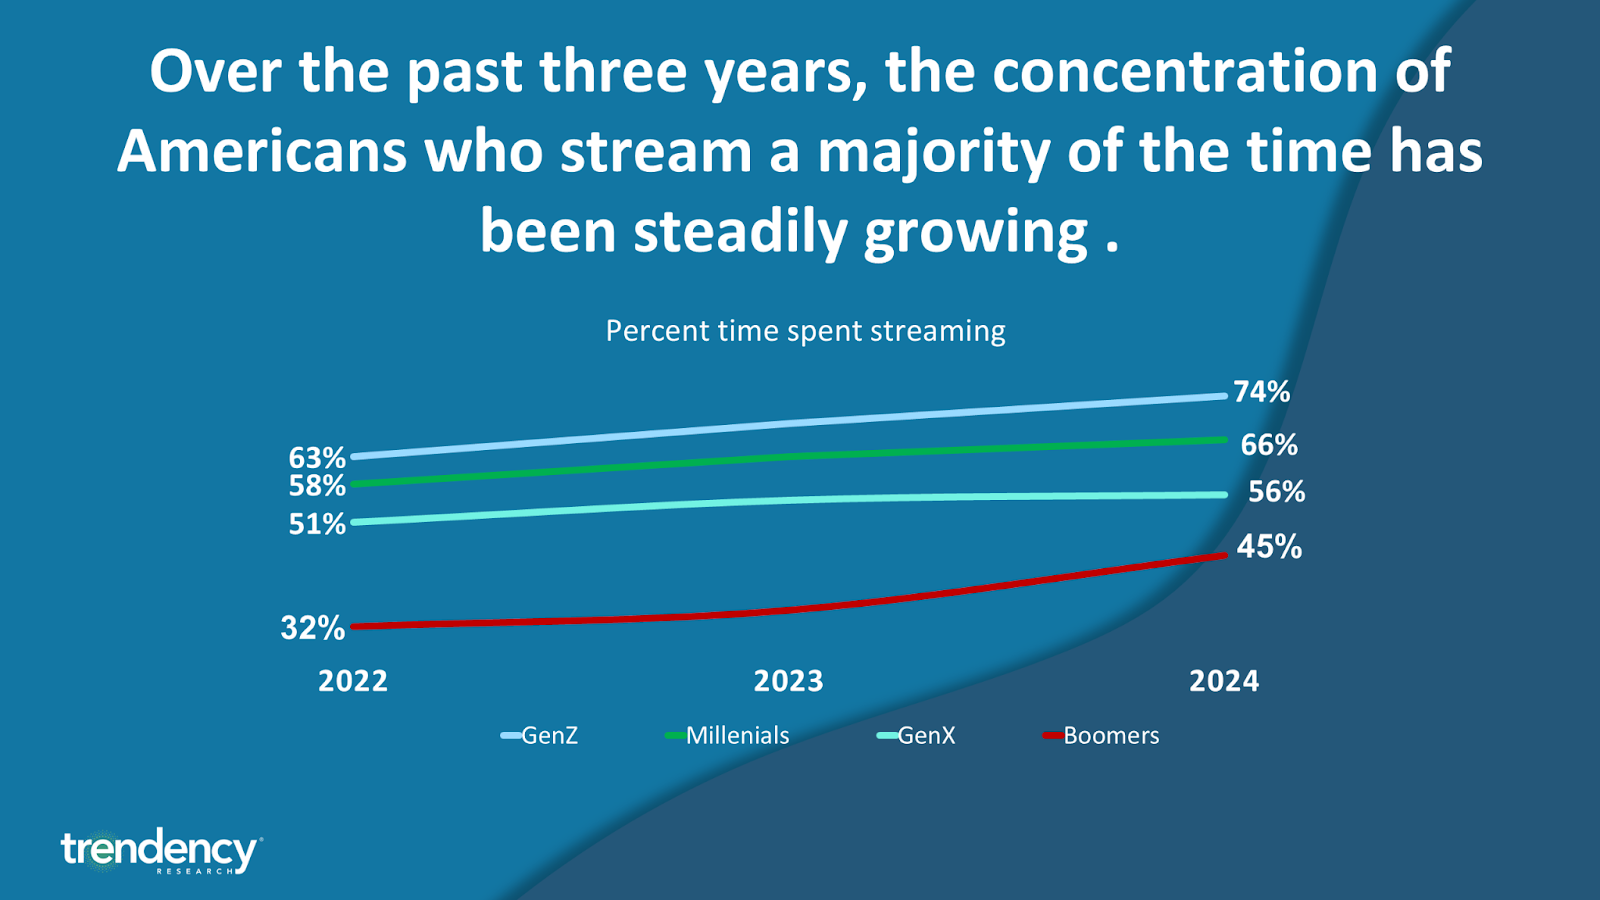
While these differences are apparent, every generation has shown growth in the time spent streaming over the past three years. Gen Z has always had the highest concentration of time streaming; however, Boomers have had the largest growth over this time period. Gen Z grew by 17.5% from 2022 to 2024, while Millennials grew by 13.8% over the same time period. Gen X had the slowest growth (9.8%) while the time Boomers spend streaming grew by a whopping 40.6% since 2022.
Clearly, as streaming services become more popular we can expect to see the data for percent of time spent watching cable decrease. What is more telling, from our perspective, is the concentration of those spending zero time watching cable. Last year the percentage of people spending no time watching cable jumped from 33% in 2022 to 44% in 2023, a 33% increase. Over the past year, the number rose, but only by a percentage point. On the opposite end of the spectrum, the percentage of Americans who spend nearly all their time watching cable dropped from 17% in 2023 to 13% this year. Further, those spending the majority of their time watching cable (51% of the time or more) was at 30% in 2022, and then proceeded to drop to 25% last year, and now stand at 22%.

Streaming Subscriptions
Given the amount of time streaming, it is not surprising to see that the percentage of households with at least one streaming subscription has steadily increased over the past four years. In 2021, 60% of Americans reported having at least one streaming subscription. Currently, the number stands at 83%. The increase over the last year was by far the smallest since we have been tracking these numbers, which is not surprising as we move ever closer to a near-universal subscription level.

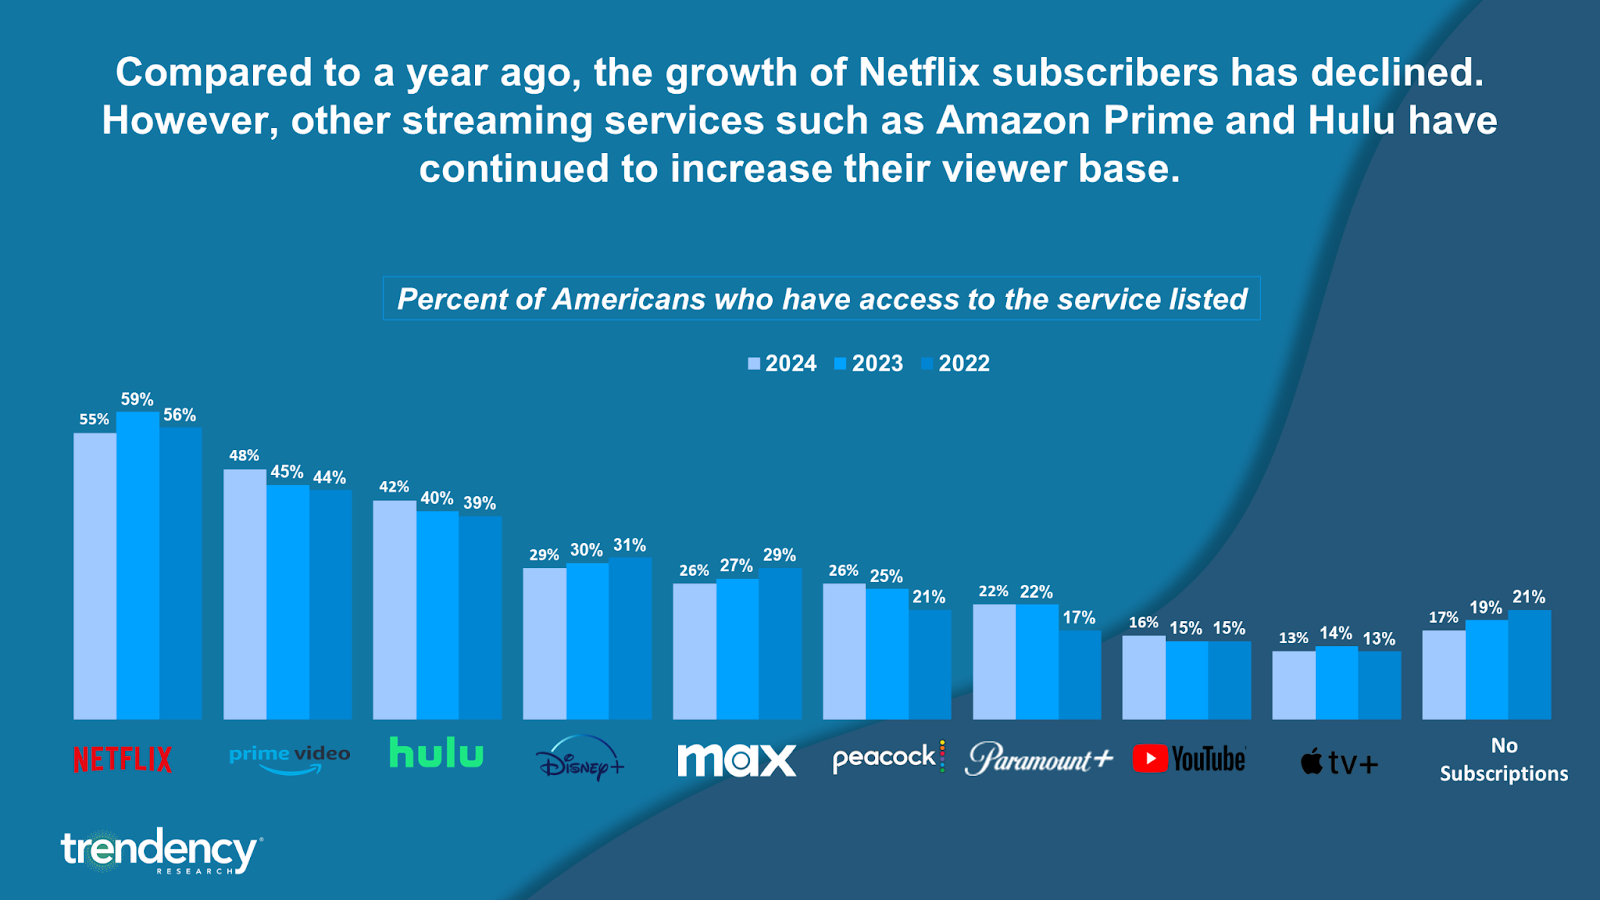
Over the past three years, Netflix has been the dominant streaming service, although the percentage of Americans who say they have a subscription has dropped in the past year. A majority of Americans have reported having a Netflix subscription over the past three years, with Amazon Prime Video coming in second. Hulu has continued to increase the percentage of households with a subscription while Disney+ has been trending in the opposite direction over the same period.
Regardless of the specific platforms, parents of children under the age of 18 have had the highest concentration of subscribers over the past three years. Since 2021, there has been a steady increase among both parents and nonparents in percentage with access to a streaming service, however, the increase has certainly slowed for both cohorts. With no discernible change between 2022 and 2023 in the percentage of parents with a subscription, the hypothesis was that we had hit a maximum concentration of subscribers. This turned out to be incorrect given the 3-point jump over the past year. Among non-parents, the growth has slowed but has been ticking up over the past four years.

When it comes to age, streaming subscriptions have been on the rise across the board for all age groups. This trend has remained especially prevalent among Americans over the age of 65 and under the age of 45. In 2024, 66% of seniors report having at least one subscription, a 5 percentage point increase from last year. Since 2021, subscription growth among this specific age group has steadily grown by 23%. Americans under 45 followed a similar trend from 2021 to 2022 as the percentage of those who reported having a subscription went from 72% to 90%. However, as we previously reported, the rate of subscription growth among those under 45 has stagnated at 90% in 2023 and then increased slightly by two percentage points in 2024.

This trend of slow but steady subscription growth can also be observed among income groups. Breaking it down by lower and higher income groups, the sharp increase in subscription rates between 2021 and 2022 is similar to the increase among parents and Americans under the age of 45. Respectively, those in the over $80k bracket went from 68% to 85% and those in the under $40k bracket increased from 57% to 72% between 2021 and 2022. After 2022, both groups did not have major increases in subscription rates as the higher income bracket stagnated at 89% and those making under $40k increased by 6%. As has always been the case, those making over $80k report a higher subscription rate overall compared to those making under $40k.

As streaming services continue to diversify and major film and television studios embrace the streaming business model such as Pamount+, cable providers continue to be diminished as viewership has steadily declined since 2021. It is important to note, similar to our last report, that this speculation is based on time spent using streaming services and not on subscription rates.
When analyzing different subscription rates among different demographic groups, the subscription trends remain overall fairly similar to last year as disparities in socioeconomic status tend to signal who can purchase no advertisements and advertisement-based subscriptions. Specifically, those who make over $80k a year tend to have higher percentages of no advertisement-based subscriptions across the board compared to those who make under $40k a year. Regardless of what group is studied, subscription rates continue to rise among all Americans but not at the same rate as 2022.
This notion of subscription rates versus time spent streaming should be further considered when monitoring subscription growth among streaming services in the future as now nearly all demographic segments have been impacted by this shift away from traditional cable. With that being said, it will be interesting to see how streaming platforms can meet both the needs of investors and the wants of consumers without hiking subscription costs.